Stock-to-Flow Model
Stock-to-Flow models Bitcoin through supply scarcity by comparing the existing stock of BTC with new annual issuance. It is a well-known long-cycle framework, but it should be treated as a model, not a guarantee.
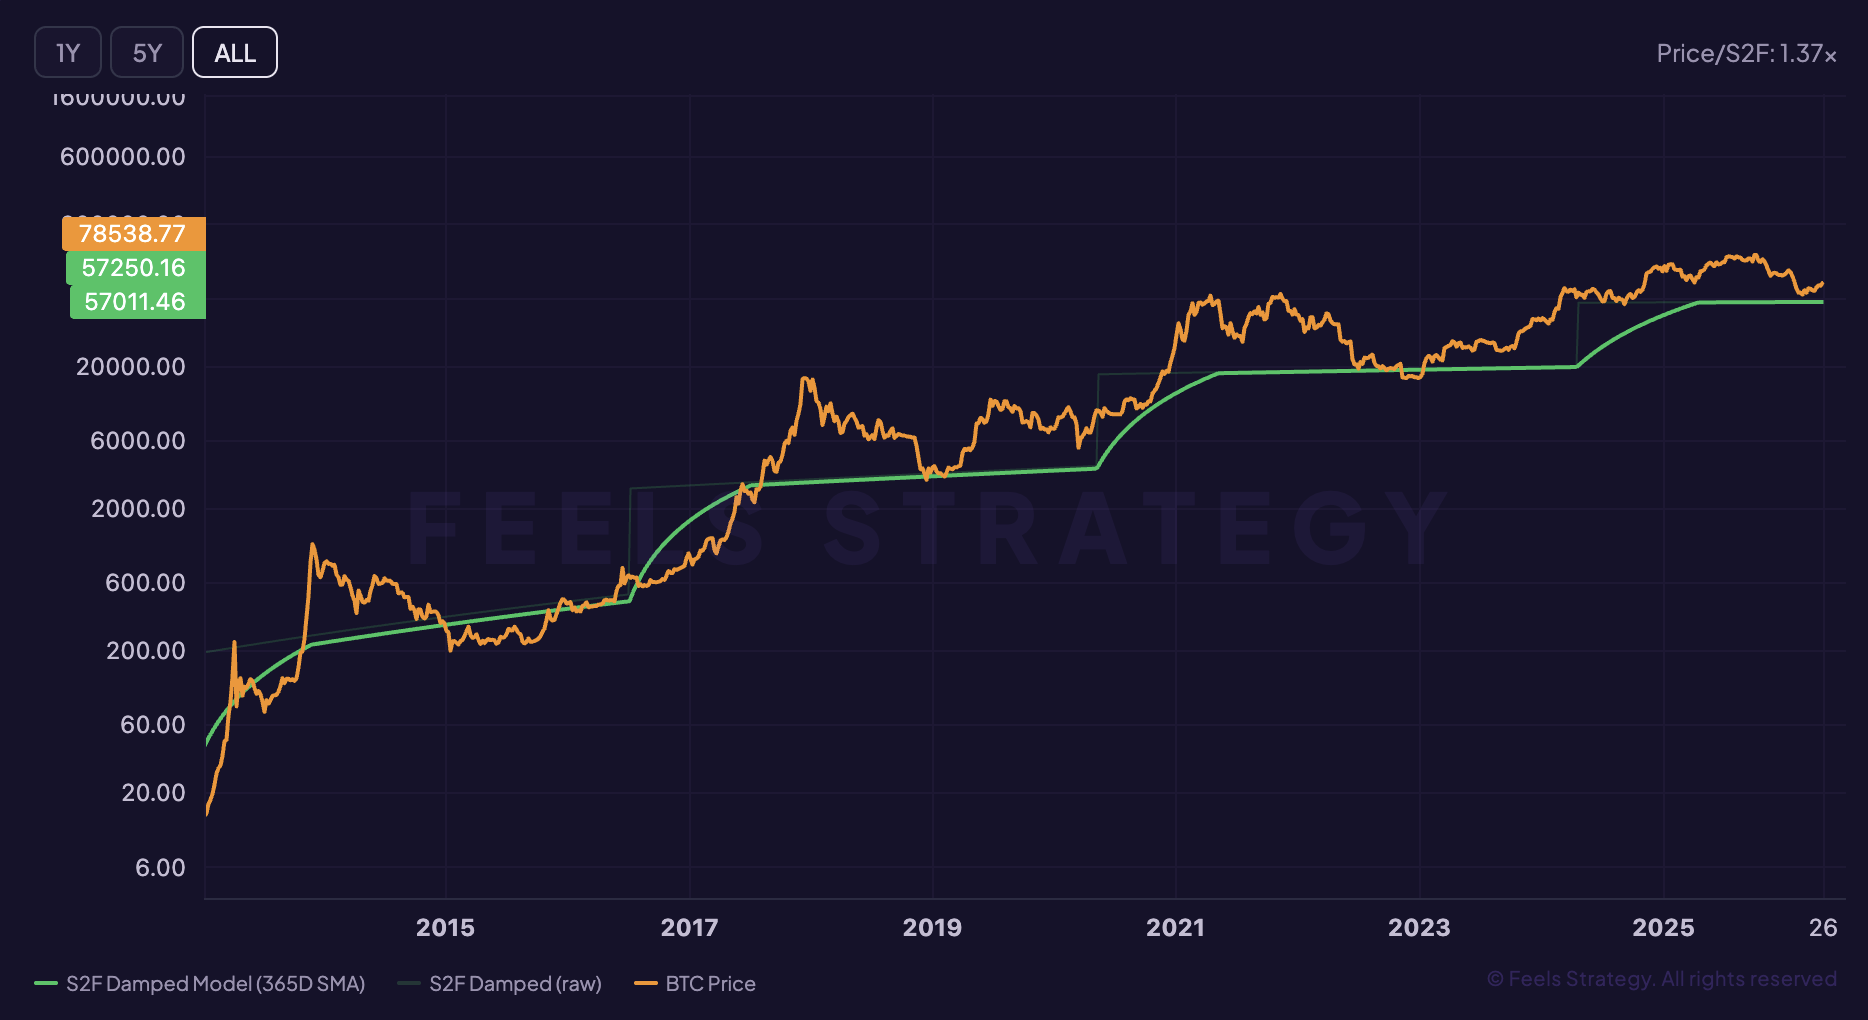
Chart preview
Stock-to-Flow Model inside the live workspace
The live workspace is available right away, so this preview section acts as a visual bridge between the explainer and the interactive chart.
Market use
Stock-to-Flow Model is usually read as where BTC may sit inside a larger market cycle inside the broader Bitcoin stack.
Live access
This guide and the live chart are both open, so you can move straight from the explainer into the interactive view.
Next step
Use the explainer here, then move into the app to compare this signal with related indicators and live BTC price context.
What it measures
Stock-to-Flow models Bitcoin price from scarcity. It borrows a framework used for gold and silver, where stock is the existing above-ground supply and flow is annual new production.
It was adapted to Bitcoin by the analyst PlanB in a March 2019 post, "Modeling Bitcoin Value with Scarcity." The idea: as each halving cuts new issuance, the stock-to-flow ratio rises, and the model maps that rising scarcity to a price curve.
It is a long-horizon scarcity narrative, not a short-term tool. It says nothing about demand, liquidity, or macro conditions, which is both its appeal and its core weakness.
Formula: SF ratio = stock / annual flow. The model then fits a power-law regression between SF and market value to produce a projected price line.
How to read it
The model plots a rising step-curve that jumps at each halving as new supply is cut. Price is read against that line.
When price tracks near the line, the scarcity narrative looks intact. When price sits far below for an extended period, the model is diverging from reality.
The historical fit looked strong from 2019 through most of 2021, which is why the model gained a large following. It is the post-2021 behavior that defines how it should be read today.
Bullish signals
- Proponents read price approaching or crossing back above the model line after a long deviation as scarcity reasserting itself, as PlanB argued during the 2024 to 2025 advance.
- A halving that tightens flow while demand holds is the structural condition the model is built around.
- Read alongside cycle tools like Halving Cycles or the 200-week SMA, a return toward trend can add weight to a broader bullish case rather than standing alone.
Bearish signals
- Sustained price below the model line is the model failing in real time, not a buy signal by itself. Treat a large persistent gap as a reason for caution about the model, not confidence in it.
- Because the model ignores demand, it gives no warning when liquidity dries up. The 2022 bear market is the clearest example.
- Late-cycle euphoria justified purely by "price must catch up to S2F" is a common trap. Confirm with demand-side and valuation tools before acting.
Limitations
- The model missed badly when it mattered most. PlanB projected about $98,000 by November 2021; price closed that month near $57,000. Through 2022 the model implied $100,000-plus while Bitcoin bottomed below $16,000.
- It is criticized on statistical grounds for spurious regression and autocorrelation, where past prices drive the fit rather than genuine predictive structure. Vitalik Buterin publicly called models that project false certainty "harmful."
- It assumes scarcity alone sets price and treats demand as irrelevant. Real markets are driven by demand, liquidity, ETF flows, and macro, none of which the model contains.
- A more honest reading adds a diminishing-returns or damping term: each cycle has historically delivered smaller percentage gains, so a raw power-law extrapolation tends to overshoot. Bitcoin maturing means future cycles likely compress versus the unadjusted model.
FAQ
Who created the Stock-to-Flow model?
The pseudonymous analyst PlanB, in a March 2019 post titled "Modeling Bitcoin Value with Scarcity." It adapts a scarcity framework long used for gold and silver.
Did the Stock-to-Flow model fail?
Its short-term price calls failed clearly. A $98,000 November 2021 target missed, and 2022 prices fell far below the model. Supporters argue it still works as a multi-year directional guide; critics consider it broken.
Why do critics dislike the model?
Because it ignores demand entirely and rests on regression methods that critics say are statistically unsound, including autocorrelation and spurious correlation between non-stationary variables.
Is Stock-to-Flow still useful?
As a scarcity narrative and conversation starter, yes. As a precise price predictor, no. It is best treated as one perspective among several, ideally with a diminishing-returns adjustment.
Why add a damping term?
Because each Bitcoin cycle has historically produced smaller percentage gains as the asset matures. A raw power-law fit extrapolates past explosive growth forward and tends to overshoot, so a damping factor brings projections closer to realistic ranges.
Related indicators
Halving Cycles
A guide to Bitcoin halving cycles, how the halving schedule affects issuance, and how traders frame each four-year market cycle.
200-Week SMA
What the Bitcoin 200-Week SMA measures, how it is calculated, and why it is widely tracked as a long-term support benchmark.
Rainbow Chart
Understand the Bitcoin Rainbow Chart, its logarithmic price bands, and how investors use it as a simple long-cycle valuation map.
MVRV Z-Score
What the Bitcoin MVRV Z-Score measures, how it is calculated, and how traders use it to spot overheated and undervalued zones.
Golden Ratio Multiplier
See what Golden Ratio Multiplier tells you about Bitcoin trend structure, long-term support, and when the market looks extended or compressed.
Ready to explore Stock-to-Flow Model on live data?
Open the interactive Stock-to-Flow Model chart inside FEELS Analytics and compare it with the rest of the indicator library in the app.