Halving Cycles
Bitcoin's halving schedule cuts new issuance roughly every four years. Many analysts use those events to frame long-cycle supply pressure, miner economics, and major market phases.
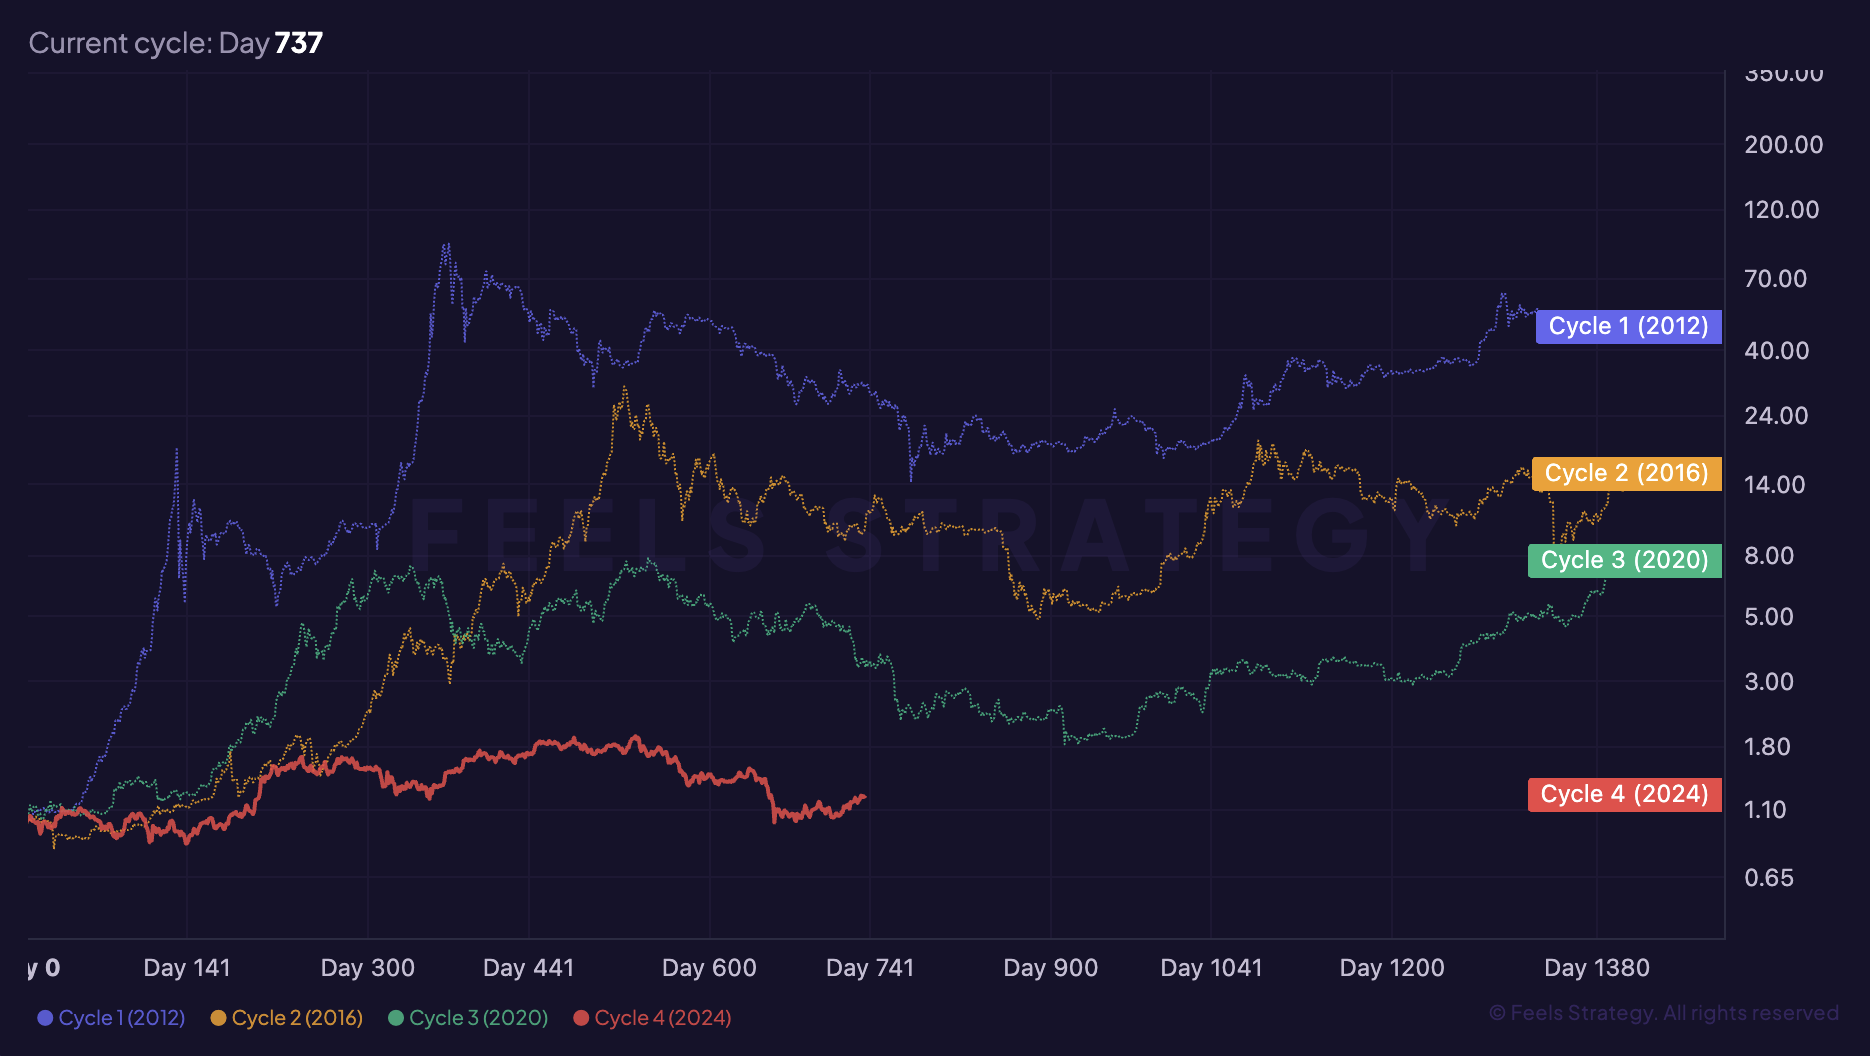
Chart preview
Halving Cycles inside the live workspace
The live workspace is available right away, so this preview section acts as a visual bridge between the explainer and the interactive chart.
Market use
Halving Cycles is usually read as where BTC may sit inside a larger market cycle inside the broader Bitcoin stack.
Live access
This guide and the live chart are both open, so you can move straight from the explainer into the interactive view.
Next step
Use the explainer here, then move into the app to compare this signal with related indicators and live BTC price context.
What it measures
It organizes market history around Bitcoin halving events.
It helps compare where price action sits relative to previous post-halving expansions and drawdowns.
It is useful for macro framing even when the market does not follow a perfect four-year script.
How it is calculated
- There is no single formula; the framework maps price and time around each halving date.
- Each halving reduces the block subsidy, lowering new BTC issuance.
- Analysts then compare pre-halving, post-halving, and late-cycle behavior across history.
How it behaved in past cycles
- Past cycles often showed accumulation before the halving and stronger momentum later in the post-halving window.
- Cycle timing still varies, so the model is a framework for context, not a guarantee.
- Macro liquidity, regulation, and institutional flows now matter more than in early Bitcoin history.
How traders usually use it
- Use Halving Cycles to frame where BTC may sit inside a larger market cycle before reacting to shorter-term BTC price moves.
- Compare the current reading with prior cycle extremes instead of reacting to a single daily move in isolation.
- Pair it with Pi Cycle Top and Rainbow Chart so one signal is confirmed from a second angle.
Common mistakes
- Do not treat Halving Cycles as a standalone buy or sell trigger without broader confirmation.
- Avoid reading one spike as decisive when the indicator is meant to describe slower where BTC may sit inside a larger market cycle.
- Always check price trend, liquidity, and sentiment together before turning an indicator reading into a trade thesis.
Questions investors ask
What does Halving Cycles tell you?
Bitcoin's halving schedule cuts new issuance roughly every four years. Many analysts use those events to frame long-cycle supply pressure, miner economics, and major market phases.
How should investors use Halving Cycles?
Macro liquidity, regulation, and institutional flows now matter more than in early Bitcoin history. It works best as context, then gets confirmed with price trend, macro conditions, or related indicators.
Can you access Halving Cycles in FEELS Analytics?
This guide and the live chart are both open, so you can move straight from the explainer into the interactive view.
Ready to explore Halving Cycles on live data?
Open the interactive Halving Cycles chart inside FEELS Analytics and compare it with the rest of the indicator library in the app.