Pi Cycle Top
Pi Cycle Top is a trend-based signal that became popular because past bull-market tops clustered around a moving-average crossover. Traders usually treat it as a warning sign, not a predictive certainty.
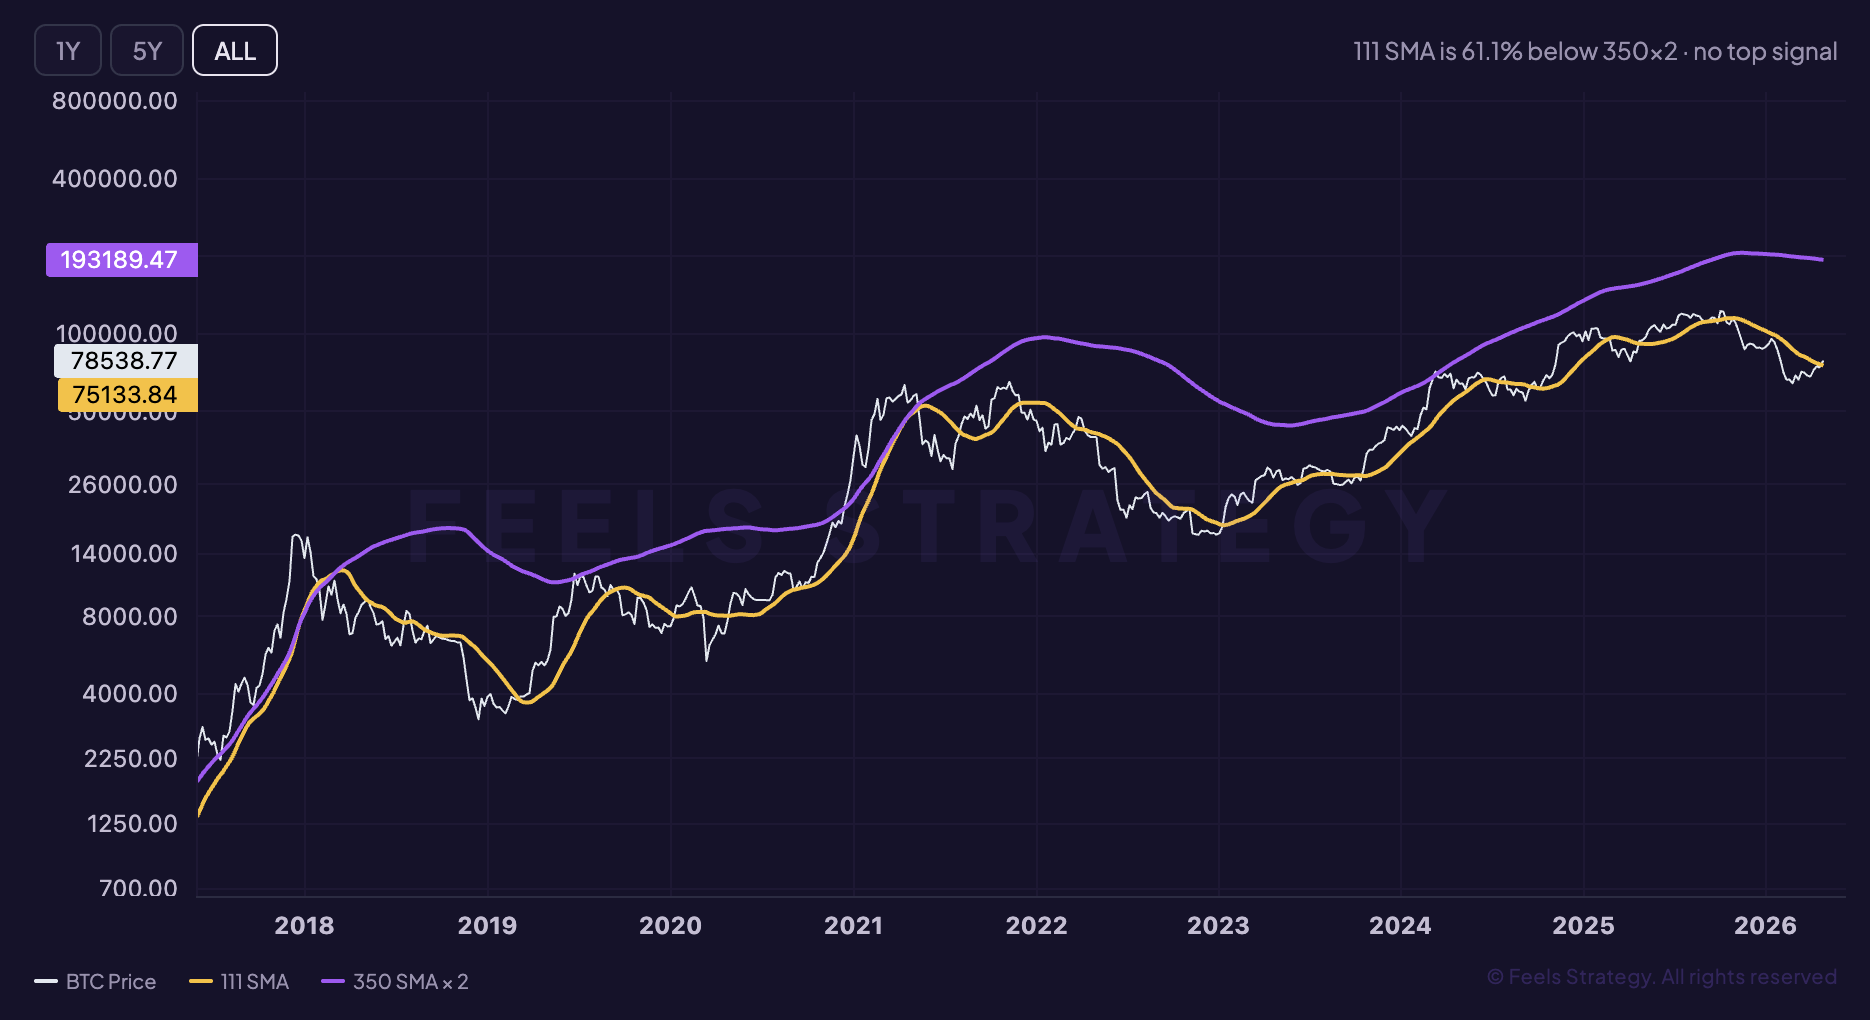
Chart preview
Pi Cycle Top inside the live workspace
The full chart view unlocks after sign in, so this preview block gives search visitors product context before they create an account.
Market use
Pi Cycle Top is usually read as where BTC may sit inside a larger market cycle inside the broader Bitcoin stack.
Live access
This guide is public. Create a free account to unlock the current Pi Cycle Top chart inside the app and remove the teaser state.
Next step
Use the explainer here, then move into the app to compare this signal with related indicators and live BTC price context.
What it measures
Pi Cycle Top is a trend-compression model built around a crossover between a faster and a slower moving-average framework. The specific construction became popular because that crossover landed close to several major Bitcoin cycle tops.
The model is not trying to estimate fair value. Instead, it asks whether price acceleration has reached the kind of unsustainable late-cycle speed that previously showed up near blow-off phases.
That makes it a warning indicator rather than a broad market compass. It is most useful when the rest of the environment already looks euphoric and investors want a simple trigger to watch for exhaustion risk.
How to read it
The classic interpretation watches the 111-day moving average relative to 2x the 350-day moving average. A crossover between them historically drew attention because it aligned closely with major top zones.
If the lines are still clearly separated, the model is not signaling the same late-cycle compression that existed near earlier peaks. In that state, the absence of a signal matters as much as the signal itself.
The historical sample is small. Bitcoin only has a few full major cycles, so Pi Cycle Top should be read as a regime-warning model, not as a mathematically complete law of the market.
Bullish signals
- A bullish read is often simply the absence of a crossover while price continues rising. That suggests the market has room to expand without yet matching the terminal acceleration seen near prior blow-offs.
- Another constructive setup appears when the market cools off, the averages widen again, and price re-establishes trend without the model ever flashing a top signal. That kind of reset can prolong a cycle.
- The broader context matters: when halving-cycle timing, valuation, and sentiment all remain supportive while Pi Cycle Top stays inactive, it argues against assuming every rally is already at the end-stage.
Bearish signals
- The strongest bearish signal is the actual crossover itself during a euphoric environment, because that is the condition that made the model famous in the first place.
- Risk also rises when the two curves compress quickly while price is already in a steep vertical move. Even before the cross, that behavior tells you trend acceleration is becoming unstable.
- If a crossover appears while MVRV, Fear and Greed, or broader cycle models are also stretched, the signal becomes more credible than if Pi Cycle Top is acting alone.
Limitations
- The sample size is tiny. A model built from a few historical cycle tops can look cleaner in hindsight than it will in a larger future sample.
- Moving averages lag price by design, so the indicator is a warning layer, not a leading valuation model.
- It says far less about bottoms, sideways markets, or mid-cycle consolidations than it does about terminal acceleration near tops.
FAQ
What does Pi Cycle Top try to detect?
It tries to detect the kind of late-cycle trend acceleration that historically clustered near major Bitcoin tops by watching a specific moving-average crossover.
Does Pi Cycle Top always call the exact top?
No. It is a warning model, not an exact peak predictor. Its value is in highlighting a narrow zone of elevated late-cycle risk, not in forecasting the single highest candle.
What is bullish for Pi Cycle Top?
The bullish state is usually that the crossover has not happened yet and the market still has room to trend higher without reaching historical top-style compression.
Should Pi Cycle Top be used alone?
No. It becomes much more useful when confirmed by valuation and sentiment extremes such as high MVRV Z-Score readings or extreme greed conditions.
What should investors pair with Pi Cycle Top?
Halving Cycles, Rainbow, Fear and Greed, and MVRV Z-Score are natural complements because they help answer whether the market is also stretched in other ways.
Related indicators
Halving Cycles
A guide to Bitcoin halving cycles, how the halving schedule affects issuance, and how traders frame each four-year market cycle.
Pi Cycle Bottom
Understand the Pi Cycle Bottom setup, the moving-average relationship it tracks, and how it is used to study deep market lows.
Rainbow Chart
Understand the Bitcoin Rainbow Chart, its logarithmic price bands, and how investors use it as a simple long-cycle valuation map.
MVRV Z-Score
What the Bitcoin MVRV Z-Score measures, how it is calculated, and how traders use it to spot overheated and undervalued zones.
Fear & Greed Index
See what the Bitcoin Fear and Greed Index measures, how it captures sentiment, and how investors use it to frame contrarian setups.
Ready to use Pi Cycle Top with current market data?
Keep the guide public for search, then move into FEELS Analytics with a free account to unlock the live Pi Cycle Top chart in the app.