Pi Cycle Bottom
Pi Cycle Bottom is the low-end companion to Pi Cycle Top. It tracks a long-term moving-average relationship that has historically compressed near major Bitcoin bottoms.
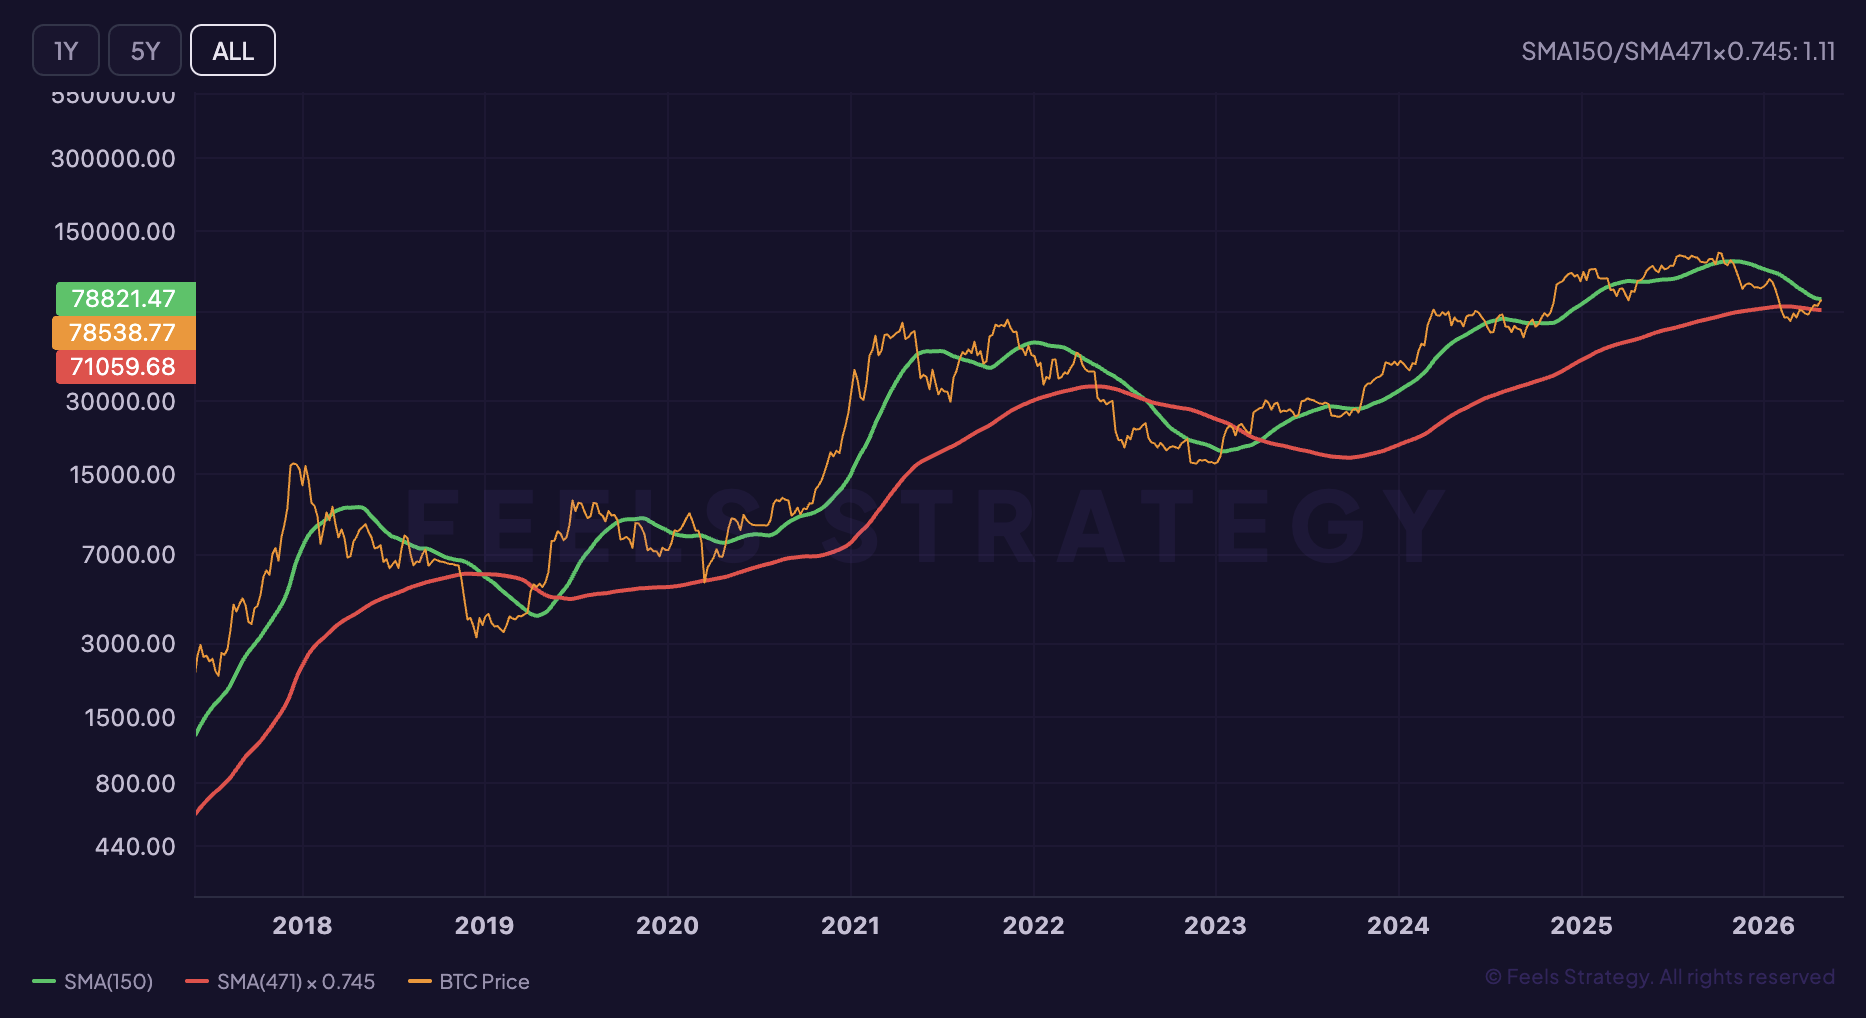
Chart preview
Pi Cycle Bottom inside the live workspace
The full chart view unlocks after sign in, so this preview block gives search visitors product context before they create an account.
Market use
Pi Cycle Bottom is usually read as where BTC may sit inside a larger market cycle inside the broader Bitcoin stack.
Live access
This guide is public. Create a free account to unlock the current Pi Cycle Bottom chart inside the app and remove the teaser state.
Next step
Use the explainer here, then move into the app to compare this signal with related indicators and live BTC price context.
What it measures
It focuses on long-term mean reversion and bear-market compression.
It is used to identify zones where long-duration downside may be closer to exhaustion.
It is more valuable as a bottoming context tool than as an exact reversal trigger.
How it is calculated
- The popular version compares the 150-day moving average with the 471-day moving average multiplied by 0.745.
- As those curves converge, analysts watch for valuation and trend compression consistent with prior lows.
- The model does not predict exact bottoms; it highlights historically important zones.
How it behaved in past cycles
- Deep bear markets brought price and these long-duration trend lines into close alignment.
- Signals are rare, which makes them useful for macro study but less helpful for frequent decision-making.
- Confirmation from valuation, miner stress, and sentiment usually improves the read.
How traders usually use it
- Use Pi Cycle Bottom to frame where BTC may sit inside a larger market cycle before reacting to shorter-term BTC price moves.
- Compare the current reading with prior cycle extremes instead of reacting to a single daily move in isolation.
- Pair it with Pi Cycle Top and Realized Price so one signal is confirmed from a second angle.
Common mistakes
- Do not treat Pi Cycle Bottom as a standalone buy or sell trigger without broader confirmation.
- Avoid reading one spike as decisive when the indicator is meant to describe slower where BTC may sit inside a larger market cycle.
- Always check price trend, liquidity, and sentiment together before turning an indicator reading into a trade thesis.
Questions investors ask
What does Pi Cycle Bottom tell you?
Pi Cycle Bottom is the low-end companion to Pi Cycle Top. It tracks a long-term moving-average relationship that has historically compressed near major Bitcoin bottoms.
How should investors use Pi Cycle Bottom?
Confirmation from valuation, miner stress, and sentiment usually improves the read. It works best as context, then gets confirmed with price trend, macro conditions, or related indicators.
Can you access Pi Cycle Bottom in FEELS Analytics?
This guide is public. Create a free account to unlock the current Pi Cycle Bottom chart inside the app and remove the teaser state.
Ready to use Pi Cycle Bottom with current market data?
Keep the guide public for search, then move into FEELS Analytics with a free account to unlock the live Pi Cycle Bottom chart in the app.