Fear & Greed Index
Fear and Greed Index is a sentiment gauge built to show whether the market is leaning toward panic or euphoria. It is popular because it compresses crowd psychology into a single daily reading.
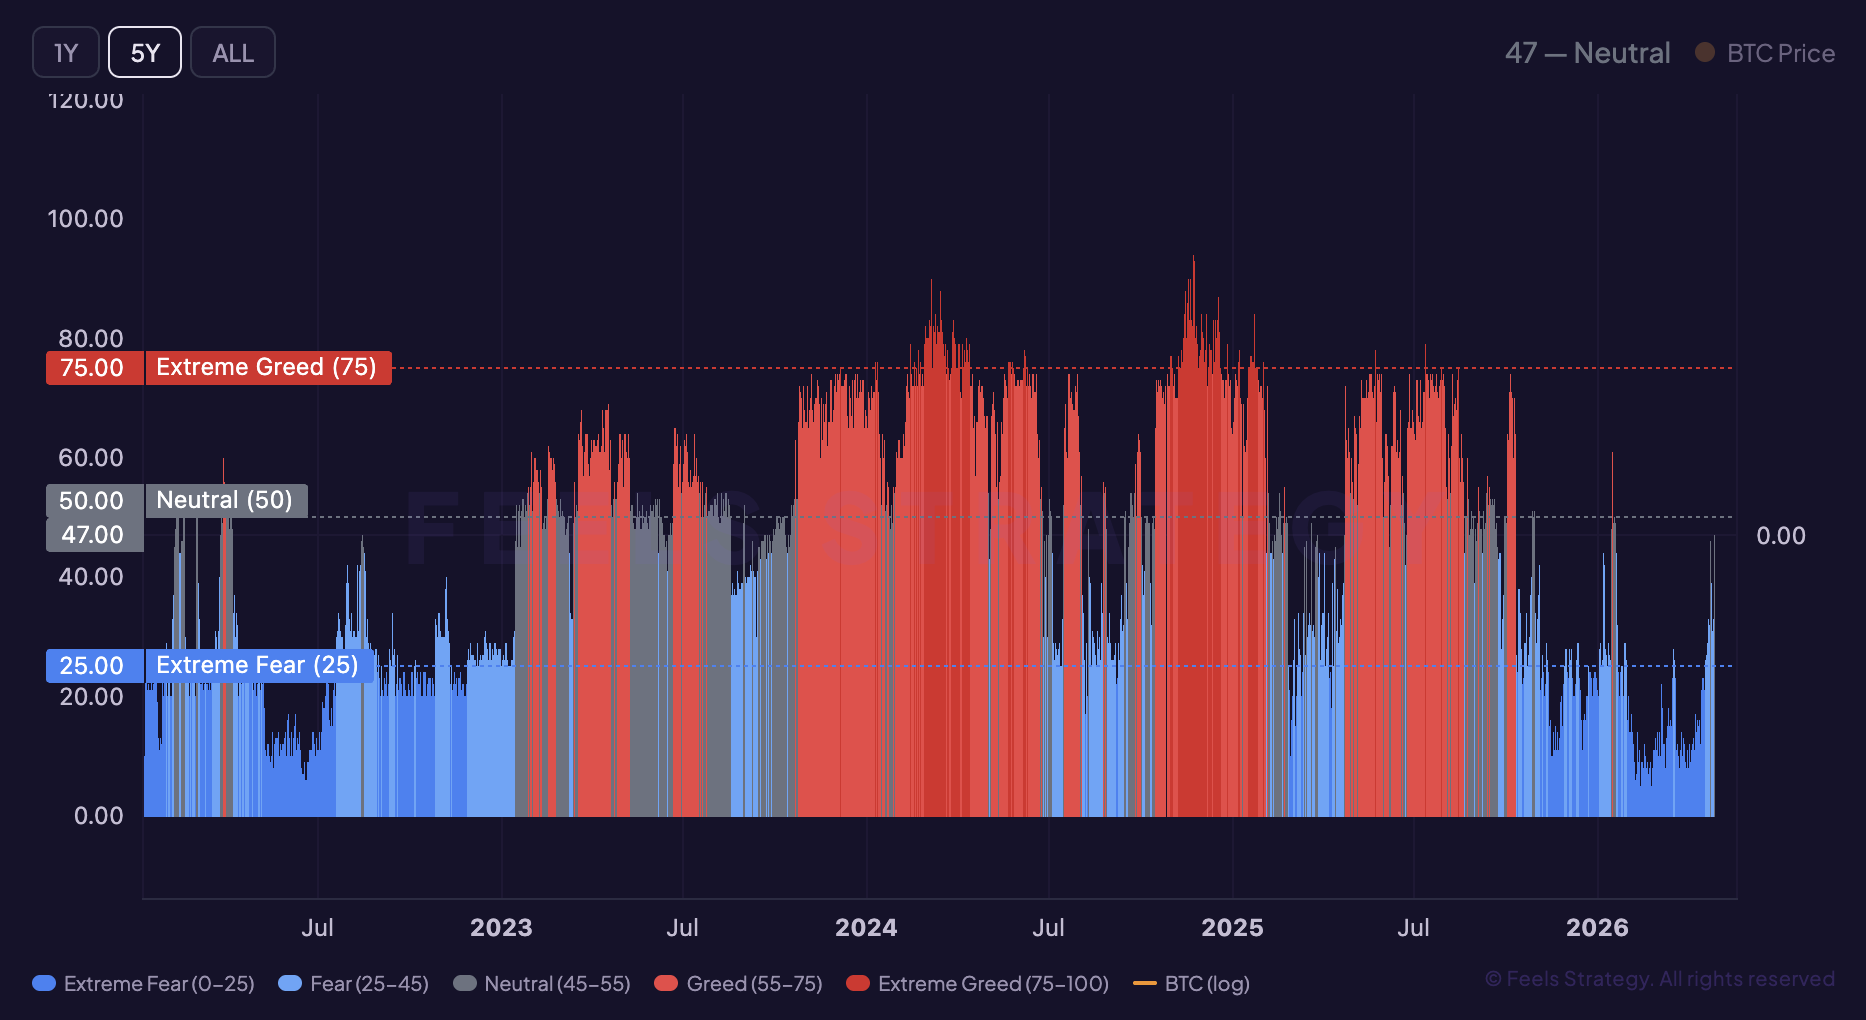
Chart preview
Fear & Greed Index inside the live workspace
The live workspace is available right away, so this preview section acts as a visual bridge between the explainer and the interactive chart.
Market use
Fear & Greed Index is usually read as crowd psychology and positioning inside the broader Bitcoin stack.
Live access
This guide and the live chart are both open, so you can move straight from the explainer into the interactive view.
Next step
Use the explainer here, then move into the app to compare this signal with related indicators and live BTC price context.
What it measures
The Crypto Fear and Greed Index compresses market psychology into a 0 to 100 score. The version most people watch is published by alternative.me and has run since around 2018.
It is built from several inputs, typically volatility, market momentum and volume, social media activity, Bitcoin dominance, and search trends, blended into one daily number.
The signal is not that emotion predicts price. It is that emotion becomes most informative at extremes: deep fear shows up in capitulation, extreme greed shows up when positioning is crowded.
How to read it
Roughly 0 to 24 is extreme fear, the zone where panic, liquidations, and capitulation narratives dominate.
The middle of the range is the least useful reading. It describes a market that is neither washed out nor euphoric, so other tools should carry more weight.
Roughly 75 and above is extreme greed. In strong bull trends it can persist, but it is the region where upside becomes crowded and vulnerable to sharp resets.
Single-digit readings are rare. They appeared during the June 2022 collapse of Terra, Three Arrows Capital, and Celsius, and again in early 2026 when the index hit a record low near 5.
Bullish signals
- Extreme fear that coincides with price stabilizing instead of falling further can signal sellers are exhausted even while headlines stay negative.
- A reset from greed back toward neutral during an uptrend, without price losing structure, suggests leverage cooled without breaking the trend.
- Some of the strongest recoveries began when the index moved out of persistent fear into a healthier mid-range rather than jumping straight from panic to euphoria.
Bearish signals
- Extreme greed during a vertical breakout is the clearest warning, especially when the index stays pinned high while price stretches further from trend.
- Greed holding high while price stops making quality highs is an emotional divergence that often precedes a larger pullback.
- Greed extremes are most dangerous when they line up with other late-cycle tools such as a stretched MVRV Z-Score or Pi Cycle compression.
Limitations
- It is a sentiment snapshot, not a valuation model. Markets can stay greedy or fearful far longer than expected in strong trends.
- The exact methodology can change over time, and a single score cannot capture all derivatives, ETF, and macro positioning.
- It is weakest used alone. Its best use is alongside price structure and on-chain context, so you know whether sentiment is stretched for a sound reason or a fragile one.
FAQ
What counts as extreme fear?
Readings in the low end of the scale, usually 0 to 24. The deepest prints came during the June 2022 contagion and a record low near 5 in early 2026. Historically those zones mattered more for long-term opportunity than short-term comfort.
What counts as extreme greed?
Readings around 75 and above, where traders are heavily biased toward more upside. It is often where macro risk starts to rise, though greed can persist through a strong trend.
Is the Fear and Greed Index a contrarian signal?
Mostly, but not mechanically. It works best as a contrarian context layer around extremes, not as an automatic trigger every time the score gets very high or very low.
Is the crypto index the same as the CNN one?
No. The CNN index measures the US stock market. The crypto version, run by alternative.me, uses crypto-specific inputs like Bitcoin dominance and on-chain volatility.
What should it be paired with?
Valuation tools like MVRV Z-Score, trend tools like Mayer Multiple, and cycle frameworks like Halving Cycles, so you can judge whether emotion is backed by broader structure.
Related indicators
MVRV Z-Score
What the Bitcoin MVRV Z-Score measures, how it is calculated, and how traders use it to spot overheated and undervalued zones.
Mayer Multiple
A practical guide to the Bitcoin Mayer Multiple, its formula, and how traders use it to compare price with the 200-day moving average.
Rainbow Chart
Understand the Bitcoin Rainbow Chart, its logarithmic price bands, and how investors use it as a simple long-cycle valuation map.
Funding Rate
What Funding Rate measures, how it reflects Bitcoin market sentiment, and how traders apply it as a positioning signal.
Halving Cycles
A guide to Bitcoin halving cycles, how the halving schedule affects issuance, and how traders frame each four-year market cycle.
Ready to explore Fear & Greed Index on live data?
Open the interactive Fear & Greed Index chart inside FEELS Analytics and compare it with the rest of the indicator library in the app.