MVRV Z-Score
MVRV Z-Score compares Bitcoin market value with realized value and normalizes the gap against historical volatility. Traders use it to judge when price is stretched far above or below on-chain cost basis.
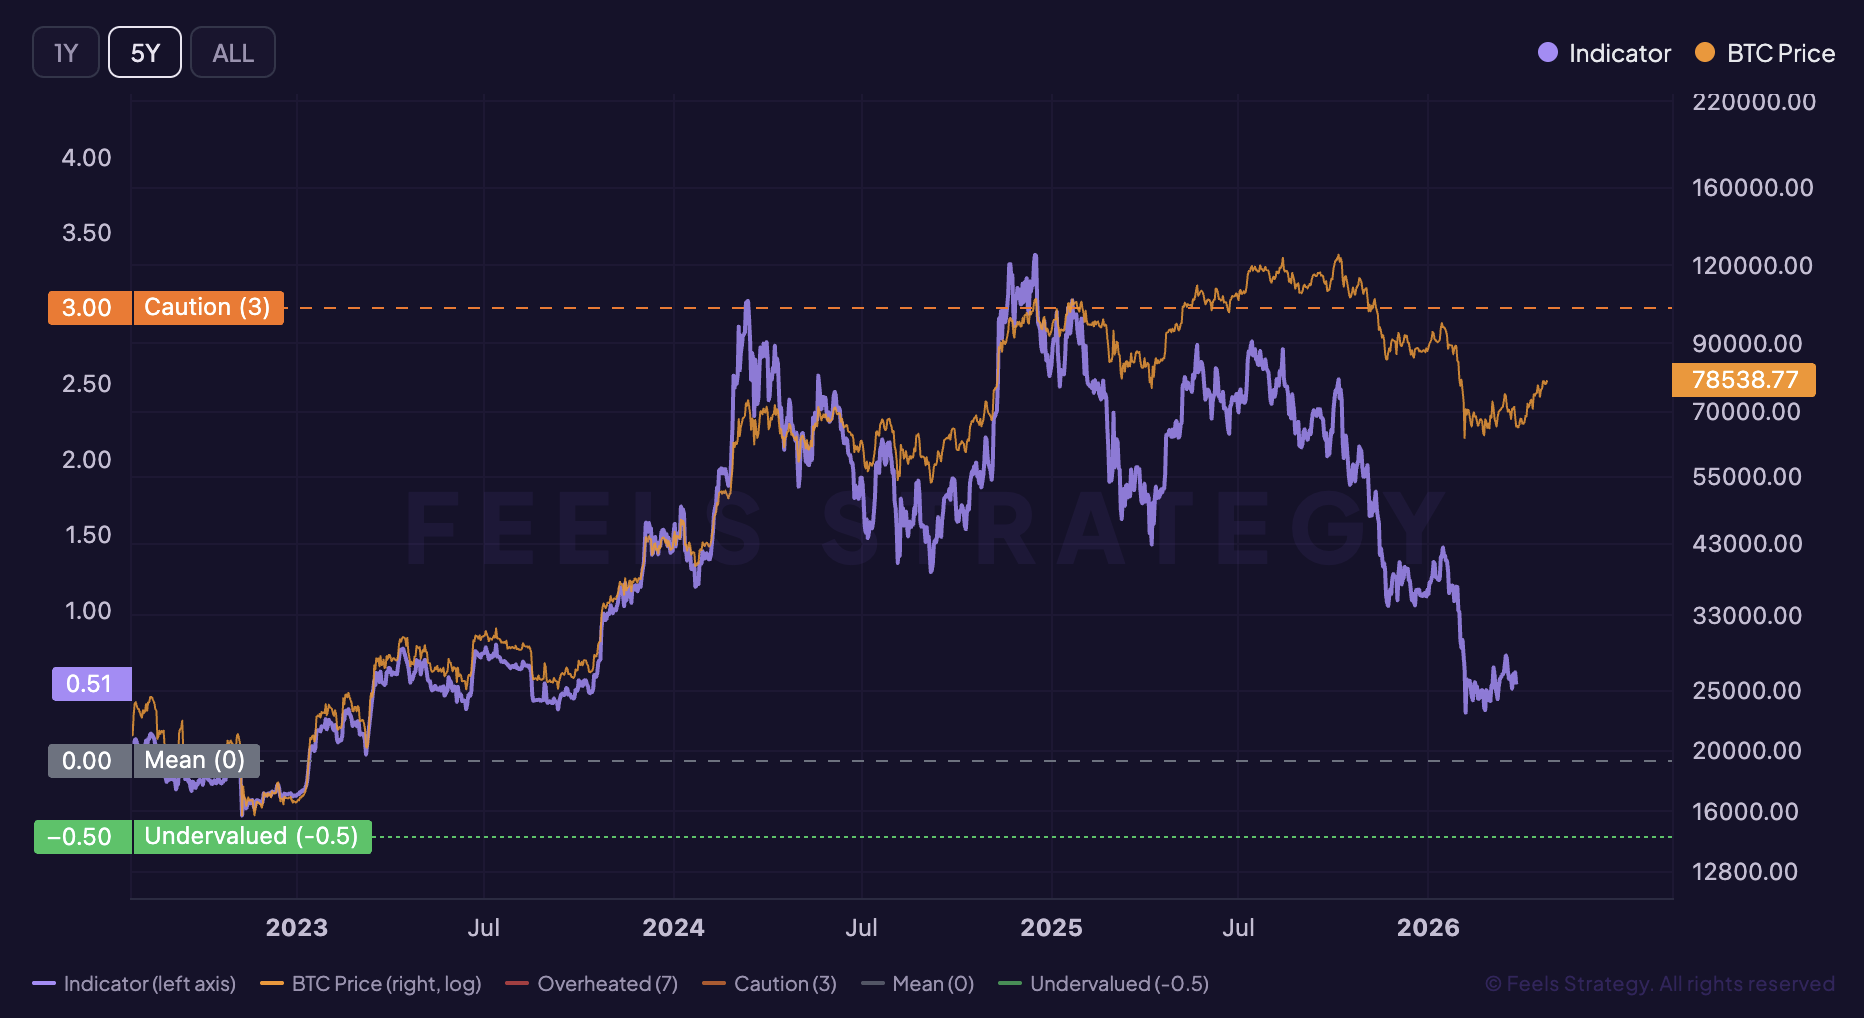
Chart preview
MVRV Z-Score inside the live workspace
The full chart view unlocks after sign in, so this preview block gives search visitors product context before they create an account.
Market use
MVRV Z-Score is usually read as valuation and cost-basis context inside the broader Bitcoin stack.
Live access
This guide is public. Create a free account to unlock the current MVRV Z-Score chart inside the app and remove the teaser state.
Next step
Use the explainer here, then move into the app to compare this signal with related indicators and live BTC price context.
What it measures
MVRV Z-Score compares two valuations of the Bitcoin network. Market value is price times circulating supply. Realized value is the aggregate on-chain cost basis: each coin valued at the price it last moved.
The Z-score normalizes the gap between them using the historical standard deviation of market value. A raw dollar gap between 2013 and 2021 is not comparable. A standardized score is.
Treat it as a cycle thermometer, not a timing trigger. It tells you whether Bitcoin sits in historically overheated or deeply compressed territory, not which day a reversal lands.
Formula: MVRV Z-Score = (Market Value - Realized Value) / standard deviation of Market Value. Market Value = current BTC price x circulating supply. Realized Value = realized cap, valuing each coin at its last on-chain move.
How to read it
High readings have clustered near cycle tops in 2013, 2017, and 2021. Exact peak values differ by data provider and normalization window, so treat the upper zone as a risk band rather than a fixed number. Most classic versions place top conditions somewhere in the 6 to 8 range.
Mid-range readings, roughly 2 to 5, describe a normal markup phase: above realized value, but not at extreme overvaluation.
Readings near 0 to 2 are low-valuation territory, where price trades close to aggregate cost basis. Historically a favorable accumulation zone.
Sub-zero readings mean realized value exceeds market value, so the average holder is underwater. Below-zero prints in 2018 and 2022 marked the deepest parts of those bear markets.
Bullish signals
- A recovery from negative territory after a long drawdown is one of the more reliable resets, since most excess optimism has already been flushed out.
- Price trending up while the Z-score stays well below the historical top band suggests the move has room to expand before reaching prior euphoria.
- In the 2015 to 2016 and 2019 to 2020 recoveries, the constructive phase was not the exact bottom print but the period after the score re-established positive momentum without overheating.
Bearish signals
- A move into the historic upper band, the zone that aligned with 2017 and 2021 tops, is the clearest macro warning.
- Price making new highs while the score sits at a stretched premium to realized value is a thinner-margin setup: upside can continue, but risk-reward degrades.
- A bearish divergence, where price prints higher highs but the Z-score makes lower highs, signals that speculation relative to cost basis is fading even before price confirms.
Limitations
- It is a macro context model, not a short-term signal. It can stay elevated or depressed for weeks or months.
- Realized cap moves slowly. It will not capture fast regime changes driven by derivatives positioning, ETF flows, or macro liquidity on its own.
- It is most trustworthy at extremes. In the middle of the range it should be confirmed with trend and sentiment tools before acting.
FAQ
What MVRV Z-Score reading signals a top?
Historically the upper band, often cited somewhere between 6 and 8 on the classic version, aligned with 2013, 2017, and 2021 tops. Exact peak values differ by provider, so it is best read as a risk zone, not a precise trigger.
What does a negative MVRV Z-Score mean?
It means realized value is above market value, so the average holder is at a loss. Sub-zero readings in 2018 and 2022 marked bear-market bottoms and have historically been long-term accumulation zones.
Why do MVRV Z-Score charts show different peak values?
Because providers use different normalization windows and realized-cap methodologies. The shape of the cycle is consistent across versions, but the exact peak number is not, which is why the zone matters more than the digit.
Is MVRV Z-Score better than the plain MVRV ratio?
It answers a sharper question. The plain ratio shows the gap; the Z-score shows how unusual that gap is relative to Bitcoin's own history, which makes it comparable across cycles.
What should MVRV Z-Score be paired with?
Use it as the valuation layer, then confirm with trend tools like Mayer Multiple or the 200-week SMA, and sentiment tools like Fear and Greed.
Related indicators
Realized Price
Learn how Bitcoin Realized Price is calculated from realized cap and why it often acts as a long-term cost-basis reference.
NUPL
Learn what the Bitcoin NUPL indicator measures, how traders interpret it, and how it fits into valuation and cycle analysis.
Mayer Multiple
A practical guide to the Bitcoin Mayer Multiple, its formula, and how traders use it to compare price with the 200-day moving average.
200-Week SMA
What the Bitcoin 200-Week SMA measures, how it is calculated, and why it is widely tracked as a long-term support benchmark.
Fear & Greed Index
See what the Bitcoin Fear and Greed Index measures, how it captures sentiment, and how investors use it to frame contrarian setups.
Ready to use MVRV Z-Score with current market data?
Keep the guide public for search, then move into FEELS Analytics with a free account to unlock the live MVRV Z-Score chart in the app.