Realized Price
Realized Price estimates the average on-chain cost basis of the market. It is widely used as a long-term reference level for value and capitulation.
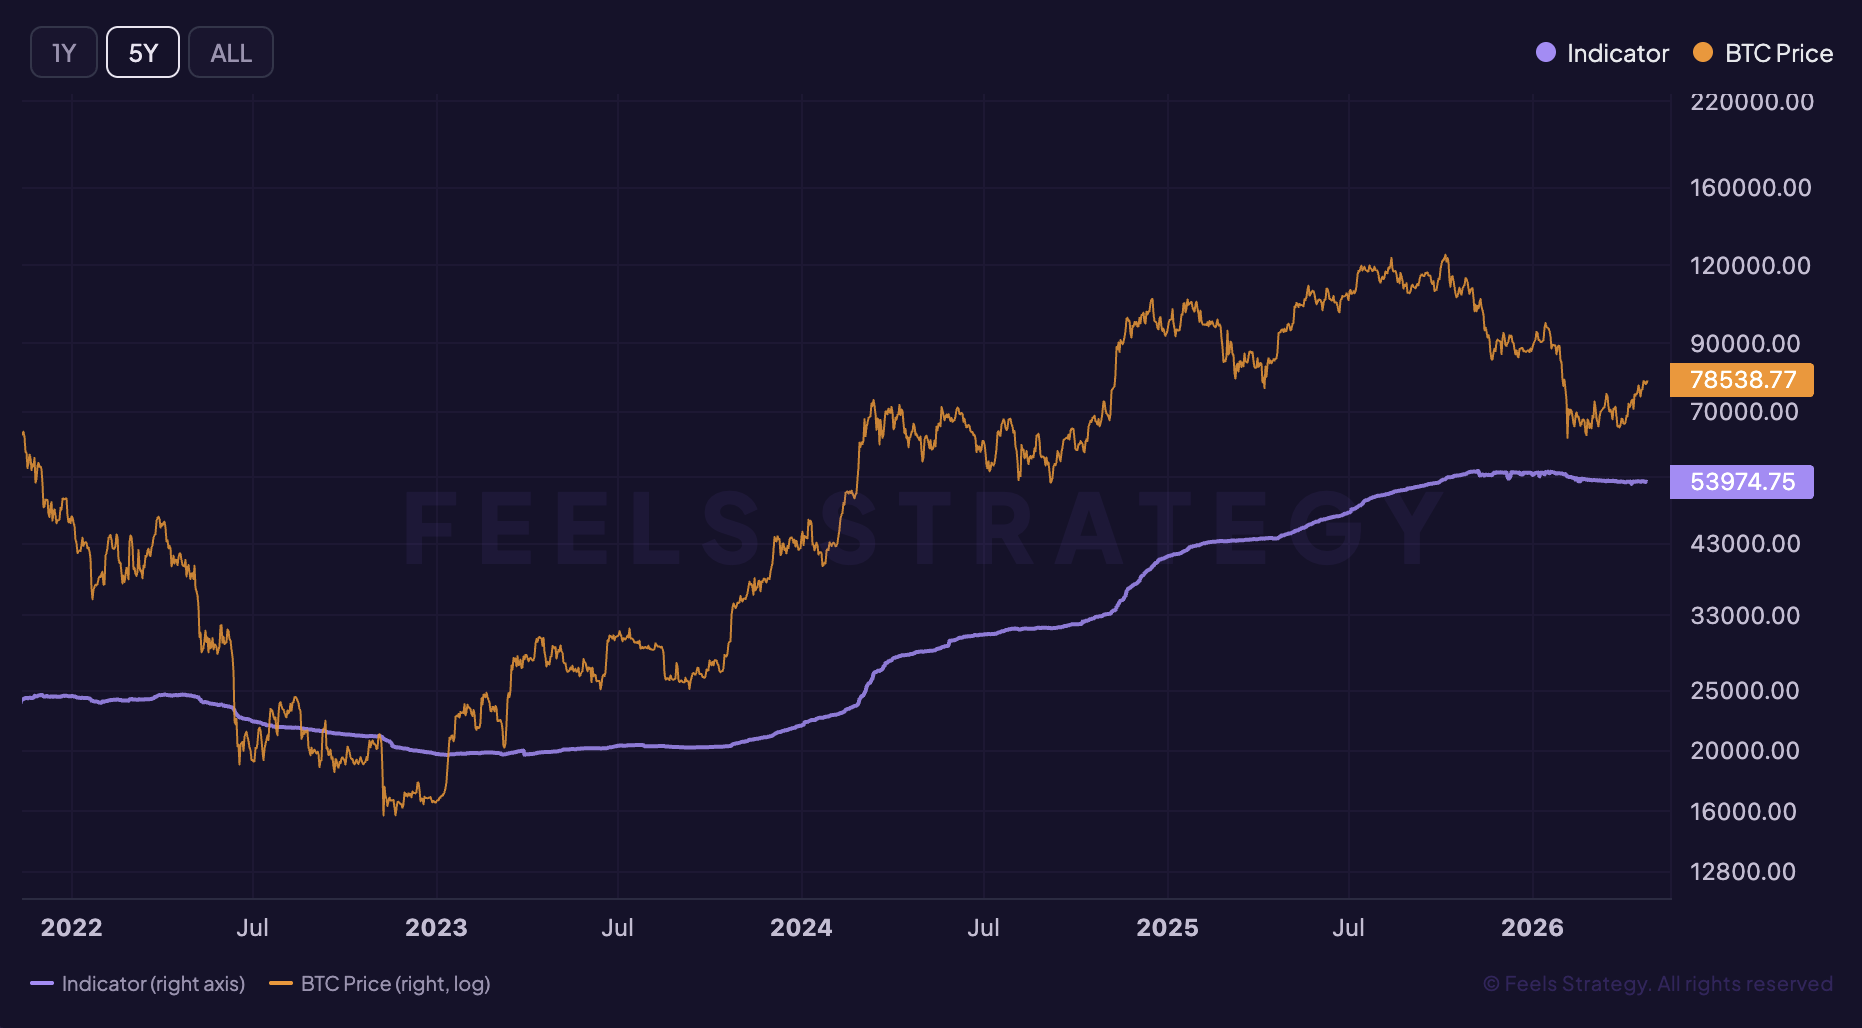
Chart preview
Realized Price inside the live workspace
The full chart view unlocks after sign in, so this preview block gives search visitors product context before they create an account.
Market use
Realized Price is usually read as valuation and cost-basis context inside the broader Bitcoin stack.
Live access
This guide is public. Create a free account to unlock the current Realized Price chart inside the app and remove the teaser state.
Next step
Use the explainer here, then move into the app to compare this signal with related indicators and live BTC price context.
What it measures
It tracks the average cost basis implied by the realized cap of Bitcoin.
It can highlight when spot price moves far above or below the aggregate holder cost basis.
It is especially useful for framing whether the market is trading in profit or stress on a cycle basis.
How it is calculated
- Realized Cap sums each coin at the price where it last moved on-chain.
- Realized Price = Realized Cap / circulating supply.
- When BTC trades below realized price, the average holder is effectively underwater.
How it behaved in past cycles
- In past bear markets, spot price approached or briefly undercut realized price during capitulation phases.
- During strong expansions, realized price tends to stay well below spot and rise more gradually.
- The level is strongest when combined with momentum or sentiment tools rather than used alone.
How traders usually use it
- Use Realized Price to frame valuation and cost-basis context before reacting to shorter-term BTC price moves.
- Compare the current reading with prior cycle extremes instead of reacting to a single daily move in isolation.
- Pair it with MVRV Z-Score and 200-Week SMA so one signal is confirmed from a second angle.
Common mistakes
- Do not treat Realized Price as a standalone buy or sell trigger without broader confirmation.
- Avoid reading one spike as decisive when the indicator is meant to describe slower valuation and cost-basis context.
- Always check price trend, liquidity, and sentiment together before turning an indicator reading into a trade thesis.
Questions investors ask
What does Realized Price tell you?
Realized Price estimates the average on-chain cost basis of the market. It is widely used as a long-term reference level for value and capitulation.
How should investors use Realized Price?
The level is strongest when combined with momentum or sentiment tools rather than used alone. It works best as context, then gets confirmed with price trend, macro conditions, or related indicators.
Can you access Realized Price in FEELS Analytics?
This guide is public. Create a free account to unlock the current Realized Price chart inside the app and remove the teaser state.
Ready to use Realized Price with current market data?
Keep the guide public for search, then move into FEELS Analytics with a free account to unlock the live Realized Price chart in the app.